Phase Diagram of Soil [ Step by Step Guide with Examples ]

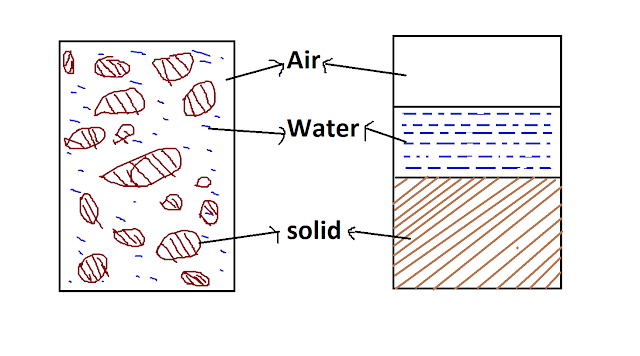
Soil Mass is the complex mixture of mainly three Particle called Water, Air, Solid. the first two particles generally fill in a porous structure. Which is formed due to space creation between solid particle. For a better understanding of particle arrangement, we see each particle separately in form of Diagram. this separation of solid, air, water called three phase diagram system of soil
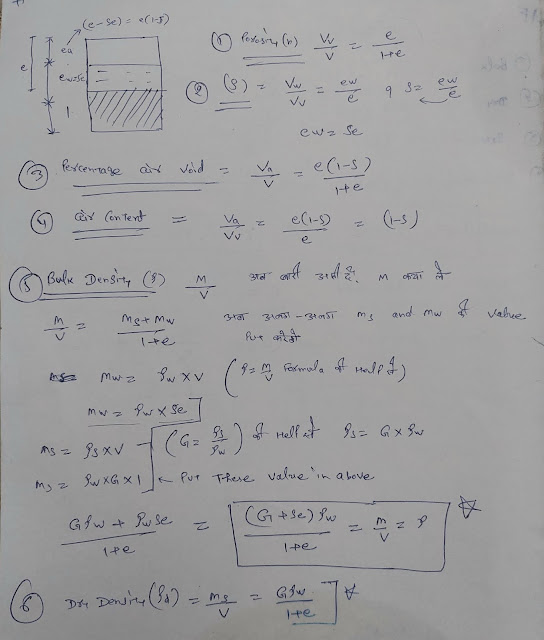
now Question is What its use in soil. and the answer, it helps to find one of the most important Relations in soil engineering. so today we talk about volumetric type relation (Void ratio, porosity of soil, degree of saturation, percentage air voids, air content). with three phase diagram of soil
fig show actual soil mass and soil in form of a three phase diagram

Three Phase Diagram of Soil

For easy understanding, we write volume part on left and mass part on the right of the diagram.

When weight considers instant of mass, its written on the right side.

Three Phase Diagram of Soil

Vv =volume of voids
Va= volume of air
Vw= volume of water
Vs= volume of solid
V= total volume

Ma = 0 mass of air is very low so we neglect it.
Mw= mass of water, Ms = mass of solid, M= total mass

Three Phase Diagram of soil

Void ratio Equation using three phase soil system

Void ratio definition

soil mass contains voids(free space between solid) which fill by Water and air. the void Ratio is the volume of voids divides by volume of solids. it’s Denoted by (e) letter.

Now because voids fill by air and water so we take 

Va+Vw =Vv  and
volume of solids = Vs

So e = Vv / Vs 

Void ratio express in decimal ex- 0.3, 0.6 etc now

the void ratio greater than 1 mean soil contains voids more than the volume of solid. and less than mean reverse case.

the coarse grain soil is less void ratio than fine grain soil because fine grain soil is the mixture of small particles that particle contains chemical charge which not allows coming closer the particle. because particle does not come closer so its space fills with voids.

The generally void ratio is used in the calculation because we separate void volume and solid volume. if change happens its effect only one value as compare to porosity where both value change.

Three Phase Diagram of Soil in Term of Void Ratio
In the preceding section, the relationships were developed independently of the dimensions of the soil mass. For convenience, the volume of solids is assumed to be one in the 3-phase diagram. Since the area of the cross-section of the soil mass is also one, the volume of  solids is also equal to the height of solids. The phase diagram below shows solids with volumes equal to unity. The void ratio is equal to the ratio between the volume of voids and the volume of solids, so the volume of void in fig show becomes e.
Three Phase Diagram of Soil in Term of Void Ratio

Two-phase diagram of soil

above we see soil consist of three particles, but it may be two particles in some case,

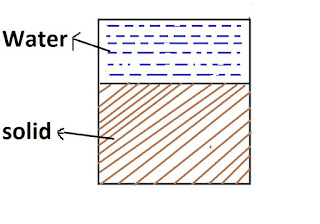
firstly say our soil mass consist of only Water and solid, that happens when the soil is fully saturated.

let’s say a soil mass consists of all three particles. Then we start adding water until its fully submerged,
now the air is gone and only two things remaining are Water and Solid

two phase diagram of soil

Its maybe only solid or air particle possibility in soil mass. that happens when you completely dry the soil mass,

so water evaporates and only solid and air remains.  as shown in fig

That’s all about three phase system of soil, now we talk about volumetric relation ex – What is the void ratio, Porosity, Degree of saturation and air voids
Leave a Reply

Your email address will not be published. Required fields are marked *