Effective communication is the cornerstone of successful project management. Traditional methods often fall short in conveying complex project timelines and interdependencies.
Gantt charts have emerged as a powerful tool to bridge this gap, offering a visual representation of project schedules that enhances understanding among stakeholders.
Understanding Gantt Charts
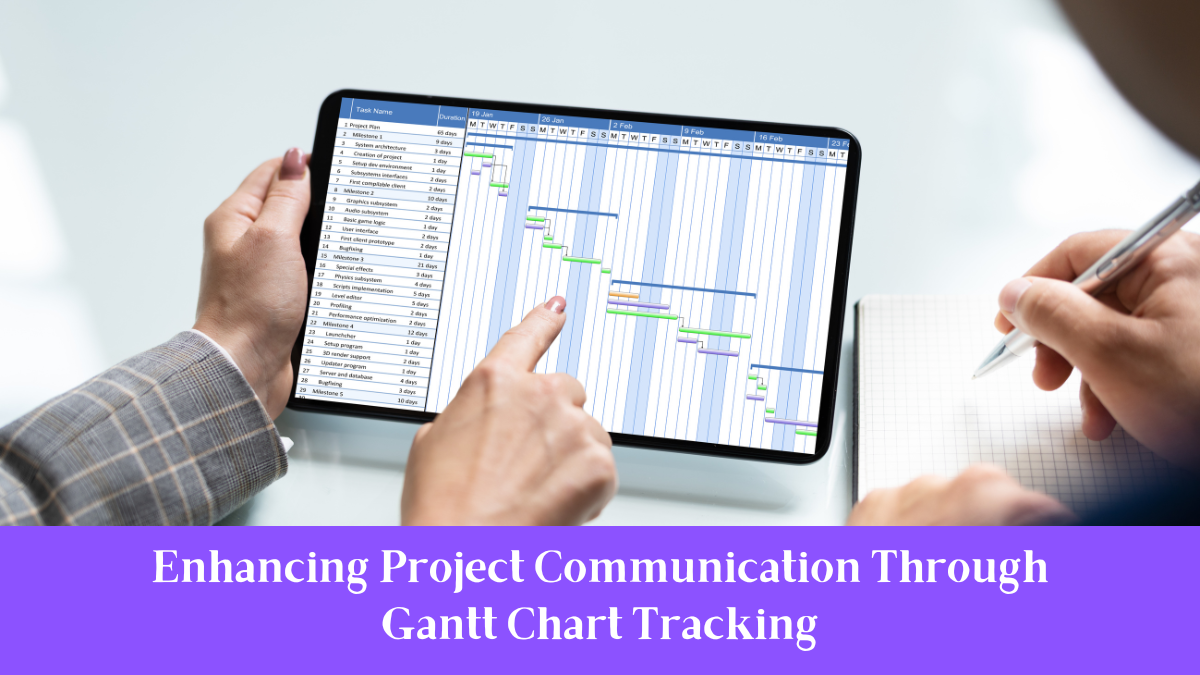
A Gantt chart is a bar chart that illustrates a project schedule. It lists the tasks to be performed on the vertical axis and time intervals on the horizontal axis. The width of the horizontal bars in the graph shows the duration of each activity.
Modern Gantt charts also show the dependency relationships between activities and the current schedule status.
Key Components Of Gantt Charts
- Task List: Enumerates all project tasks, often organized hierarchically.
- Timeline: Depicts the project duration, segmented into days, weeks, or months.
- Bars: Horizontal bars represent the start and end dates of tasks, with their length indicating duration.
- Dependencies: Arrows or lines connecting tasks to show their relationships and sequence.
- Milestones: Significant events or achievements marked to indicate progress.
How Gantt Chart Tracking Enhances Project Communication?
1. Visual Clarity Of Project Timelines
Gantt charts provide a clear visual representation of the project schedule, making it easier for team members and stakeholders to understand the sequence and duration of tasks. This clarity helps in setting realistic expectations and planning effectively.
2. Identification Of Task Dependencies
By illustrating how tasks are interrelated, Gantt charts help identify dependencies, ensuring that team members understand which tasks must be completed before others can begin. This understanding is crucial for efficient resource allocation and scheduling.
3. Real-Time Progress Monitoring
Regular updates to Gantt charts allow for real-time tracking of project progress. This enables project managers to identify delays or bottlenecks promptly and take corrective actions to keep the project on track.
4. Enhanced Stakeholder Communication
Gantt charts serve as an effective communication tool, providing stakeholders with a concise overview of the project’s status. This transparency fosters trust and facilitates informed decision-making.
5. Resource Allocation And Management
By visualizing task assignments and durations, Gantt charts assist in balancing workloads and ensuring that resources are utilized efficiently. This helps in preventing overallocation or underutilization of team members.
6. Risk Management
Gantt charts help in identifying potential risks by highlighting critical paths and dependencies. This foresight allows project managers to develop mitigation strategies proactively.
7. Facilitation Of Collaboration
With a shared visual representation of the project, team members can collaborate more effectively, understanding their roles and how their work impacts others.
8. Documentation And Reporting
Gantt charts serve as a record of the project’s progress, providing a basis for reporting to stakeholders and documenting lessons learned for future projects.
Best Practices For Using Gantt Charts
- Regular Updates: Consistently update the Gantt chart to reflect the current status of tasks and milestones.
- Clear Labeling: Ensure that all tasks, dependencies, and milestones are clearly labeled to avoid confusion.
- Integration with Other Tools: Combine Gantt charts with other project management tools, such as task management software, for a comprehensive view.
- Training for Team Members: Provide training to team members on how to read and interpret Gantt charts effectively.
- Customization: Tailor the Gantt chart to suit the specific needs of the project and the preferences of the team.
Incorporating Gantt chart tracking into project management practices significantly enhances communication by providing a clear, visual representation of project timelines, dependencies, and progress.
This clarity fosters better understanding among team members and stakeholders, leading to more efficient project execution and successful outcomes.
FAQs
1. What Is A Gantt Chart?
A Gantt chart is a visual tool used in project management to represent a project’s schedule, illustrating tasks, durations, dependencies, and milestones.
2. How Does Gantt Chart Improve Communication?
By providing a clear visual representation of the project timeline and task dependencies, Gantt charts enhance understanding among team members and stakeholders, facilitating better communication.
3. Can Gantt Charts Be Used For All Types Of Projects?
Yes, Gantt charts are versatile and can be applied to various projects, from simple tasks to complex, multi-phase initiatives.
4. Are Gantt Charts Suitable For Remote Teams?
Absolutely. Digital Gantt charts can be shared and updated in real-time, making them ideal for remote collaboration.
5. What Are The Limitations Of Gantt Charts?
While Gantt charts are powerful tools, they can become complex and unwieldy for very large projects with numerous tasks and dependencies. Regular updates and clear labeling are essential to maintain their effectiveness.


